Hello World from OSS Silicon Valley
HowToUse/R/3.3
_ Prerequisite
- Windows installation
_ Install&Setup
_ Install on Windows
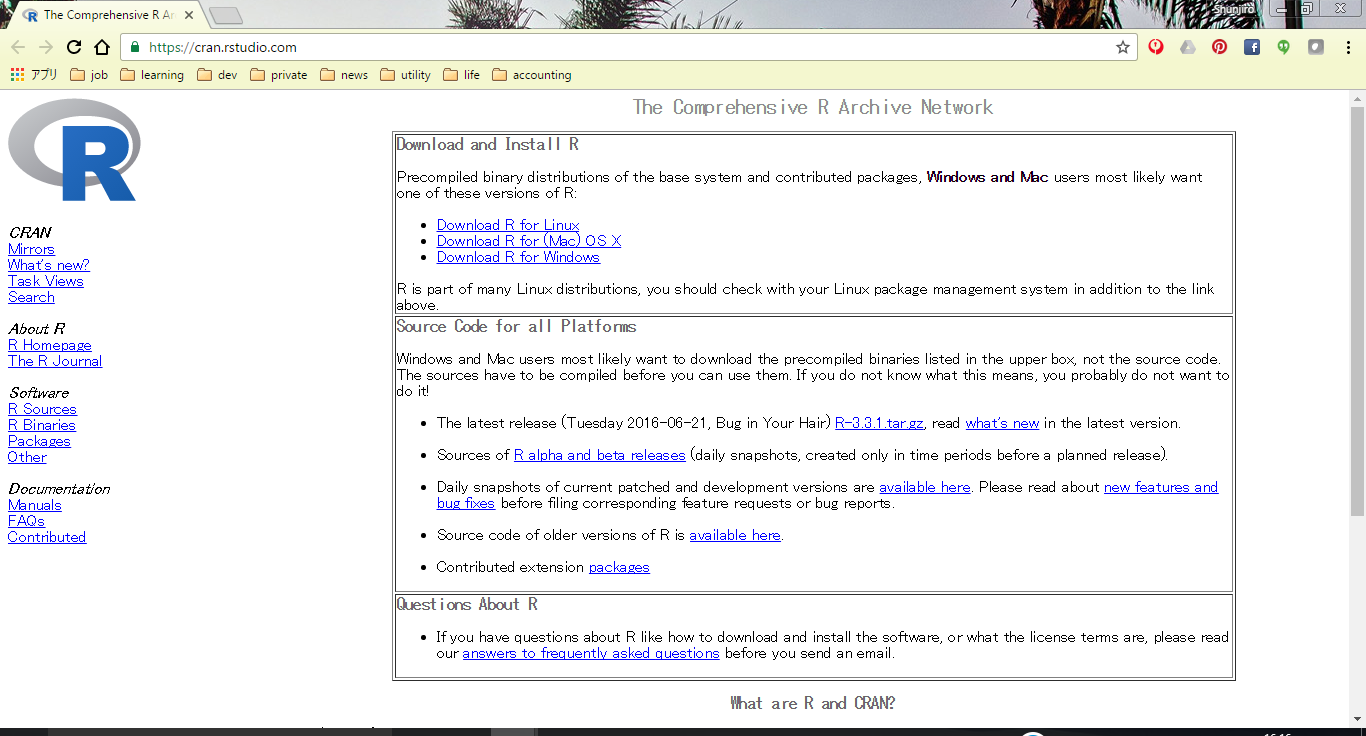
- Step.1
- Access the download site and download installer.
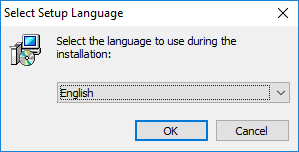
- Step.2
- Choose language.
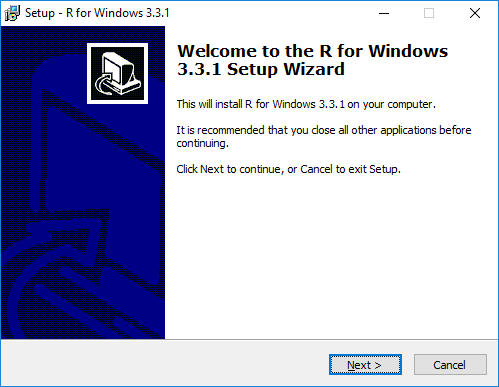
- Step.3
- Click "Next" button.
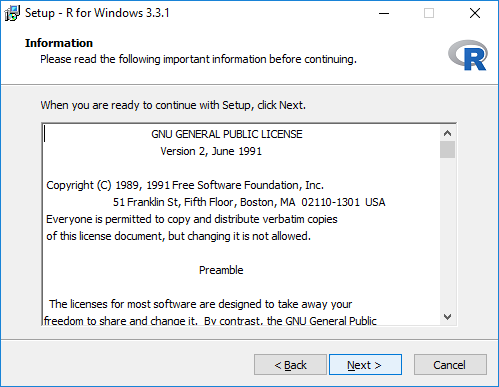
- Step.4
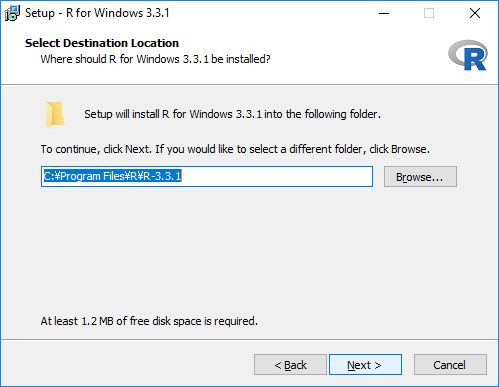
- Click "Next" button.
- Step.5
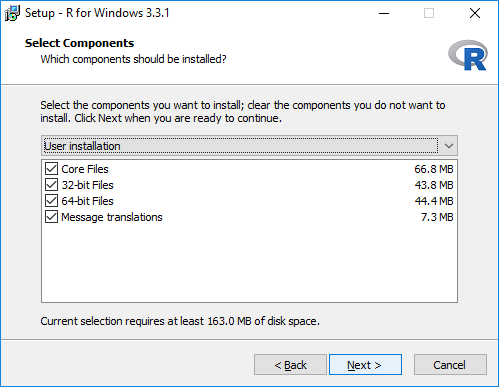
- Click "Next" button.
- Step.6
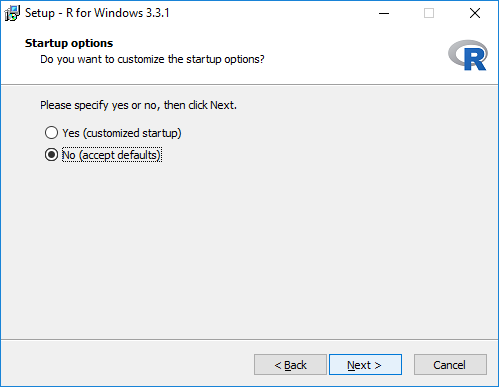
- Click "Next" button.
- Step.7
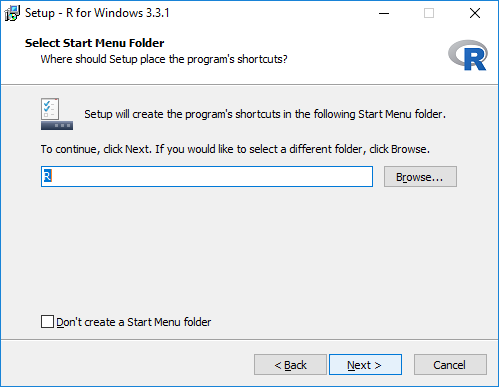
- Click "Next" button.
- Step.8
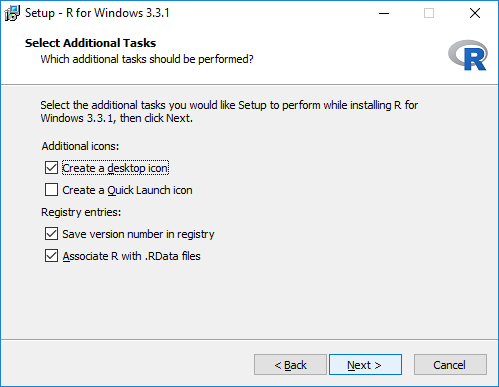
- Click "Next" button.
- Step.9
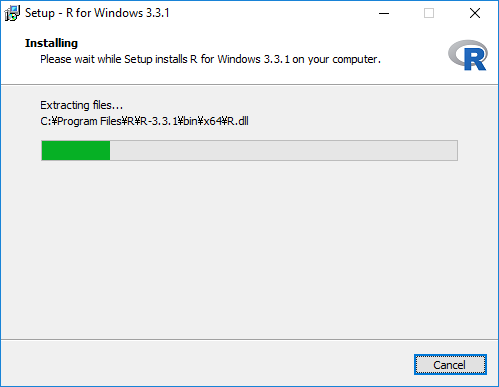
- Click "Next" button.
- Step.10
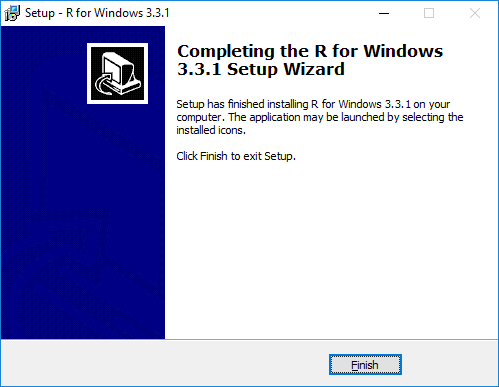
- Click "Finish" button.
_ HowToUse
_ Install modules
- Step.1
- Install modules.
> install.packages(<Package Name>)
(Example)
> install.packages("ggplot2")
You can see installed packages with the following command.
> installed.packages()
- Step.2
- Load modules.
> library("ggplot2")
You can see library list as below.
> library
_ Read data
- Step.1
- Import data.
> data<-read.csv("<CSV file>", header=TRUE)
- Step.2
- Create scatter plot.
> plot (data$X, data$Y)
_ Execute R script file.
Execute the following command to run R script file.
$ R CMD <R Script File Name>
(Example)
$ R CMD init.r
_ Author
S.Yatsuzuka
Attach file:  Install_fig6.png 143 download
[Information]
 Install_fig7.png 158 download
[Information]
 Install_fig8.png 151 download
[Information]
 Install_fig9.png 143 download
[Information]
 Install_fig5.png 150 download
[Information]
 Install_fig2.png 152 download
[Information]
 Install_fig10.png 145 download
[Information]
 Install_fig11.png 149 download
[Information]
 Install_fig3.png 156 download
[Information]
 Install_fig4.png 143 download
[Information]
 Install_fig1.png 134 download
[Information]
Last-modified: 2016-11-06 (Sun) 07:51:25 (2721d)
